The following is intended to outline our general product direction. It is intended for information purposes only, and may not be incorporated into any contract. It is not a commitment to deliver any material, code, or functionality, and should not be relied upon in making purchasing decisions.
The development, release, and timing of any features or functionality described for Oracle’s products remains at the sole discretion of Oracle.
Thomas Kurian, Executive Vice President, Product Development at Oracle, showcased the newly launched Exalytics Business Intelligence Machine at his Oracle OpenWorld keynote.


A new in-memory cache that is services by the TimesTen database. An adaptive cache algorithm that ensures that frequently accessed data is kept in-memory, thereby reducing or altogether eliminating Database hits.
The first screenshot above, in the top row, is that of Map Views - geo-spatial visualizations in the OBIEE 11g suite; the second is a new type of Scorecard visualization, known as the Strategy Wheel; the third is a screenshot from the BI Mobile app running an OBIEE Dashboard page; and the fourth is showcasing a new Trellis multi-panel visualization.

Enhancements and new capabilities in the Essbase MOLAP engine to take advantage of Exalytics.

Dave Granholm doing a demo of Exalytics.

Master-detail linking allows for in-Dashboard analysis, instantaneous updates of content on your Dashboard.

Close to a BILLION records are analyzed. Prompts that refresh at the speed of thought. Search-as-you-type capabilities.
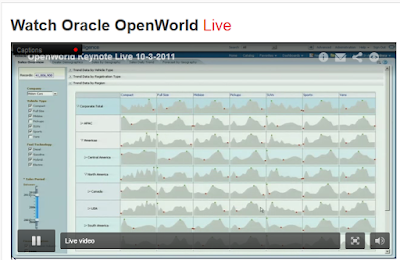
Microcharts, aka Sparklines, in their myriad forms: whether as sparkbars or sparklines, with highlighting of low and high values help visualize in an understandable manner massive amounts of data within the small confines of a single screen.

A close-up of a line graph souped up with master-detail linking.

Start at any level of aggregation.
Drill down any path, across the row or column edge of the view to drill to a deeper level of insight.

Each sparkline cell in the Trellis view is serving up tens even hundreds of data points. Multiply by a dozen rows and dozen or more columns and you are truly talking about meaningful dense data visualizations.

I need to have access to this same dashboard as I leave the office and bring out my iPad.
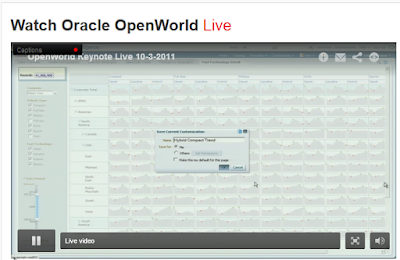
Adding this Dashboard as a Favorite means it is easier to access.

Like from my BI Mobile iPad app. With a consistent user-interface that is nonetheless optimized for a multi-touch gestural interface that is provided in the Apple iPad tablet.

More information, including a BI Mobile app demo in Balaji's general session.